Journal Profile Metric Trends
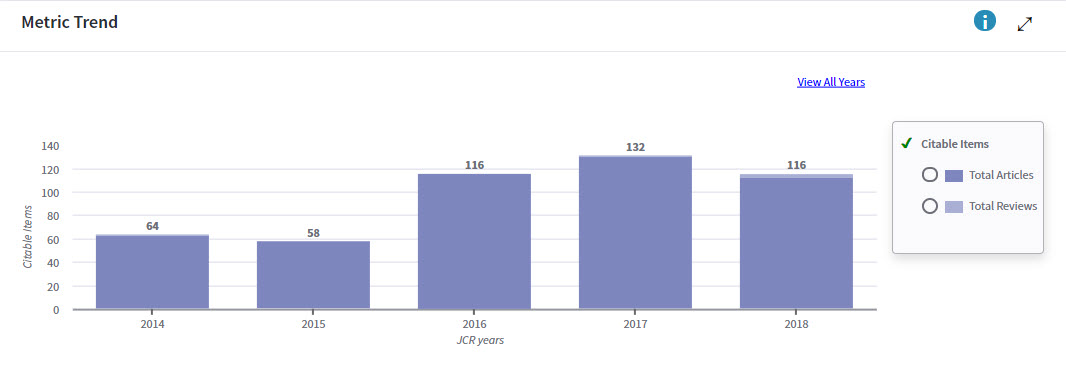
The Metric Trends graph will appear beneath the Key Indicators table when you click Graph for any of the indicators. The chosen indicator will appear as the Y axis label, while the X axis will always represent the JCR Years. JCR Years are visible for either the last five years by default, or the user may choose to View All Years.
This example shows the metric trends graph for Citable Items for the last five years for Plant Molecular Biology.

