Journal Profile
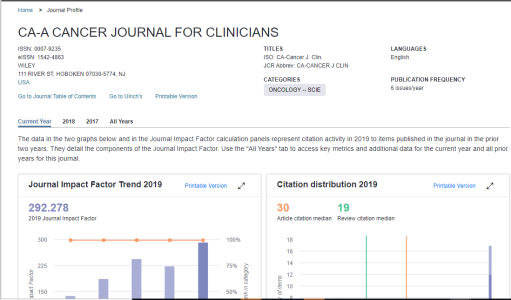
Each journal covered in the Journal Citation Reports has a Journal Profile page providing a comprehensive overview of related information and Key Indicators, allowing users to see multiple years of data in a glance. Information related to the journal's publisher, location, and publication frequency, and other criteria relevant are presented at the top of the page beneath the title.
The Journal Profile page also provides access to detailed information about the journal, data, metrics and content underlying the journal’s listing in the JCR.
The page is divided into four tabs:
- The Current Year tab displays 2019 JCR data (the following information also displays on the 2018 and 2017 tab):
- Journal Information
- Journal Impact Factor Trend
- Citation Distribution
- Journal Impact Factor Calculation
- JIF contributing Items
- Key Indicators
- Journal Source Data
- Three-year content analysis by country/region and organization
- 2018 - displays 2018 JCR data
- 2017 - displays 2017 JCR data
- All Years
When available, you can download information for each individual tile by clicking Export on the top, right side of the tile.
The Journal information panel contains:
- basic bibliographic information about the journal, including publisher, ISSN and e-ISSN (where available), open access status, language, frequency of publication, and Web of Science categorization.
e-ISSN, when available, is only applicable to the current year and 2017.
- a link to the multi-year profile grid for the journal where all prior years’ data can be accessed.
- a Printable Version link, which will create a printable HTML version of the profile page, using the expanded versions of the JIF Trend graph and Citation Distribution.
Printable version link is only available for the current year and 2017.
This graph shows the Journal Impact Factor (JIF) and Percentile Rank for the last five years in Category.
- The JIF trend is represented as a bar graph, and corresponds to the left-hand axis.
- The Percentile Rank in Category is represented as line-and-marker graph, and corresponds to the right-hand axis. Grid-lines are shown at 25th percentile, 50th percentile, and 75th percentile, allowing quick visualization of the quartile rank.
- Prior years are presented in ascending order, from the four years prior to the current JIF year to the current year. The current year JIF is highlighted, and represents the value shown above the graph. Hovering over any individual year displays the JIF for that year and the percentile rank for each category. The categories are presented in the same order shown in the category legend, which is interactive. Hovering over any legend entry highlights the data on the graph.
- To view all categories, past and present, click Show all. This will include any category that was previously assigned to the journal, but is not represented in the most recent years.
- To see the full history of both JIF, Percentile Rank, and category assignment, for a journal, click the Expand button, then use the View All Years link. This will expand the history to the first year the journal appeared in the JCR.
- A link to generate a printable version of the graph opens a new window with a view of the fully expanded graph, with all years and all categories across the JCR history of the title.
The Citation Distribution shows the frequency with which items published in the year or two years prior were cited in the JCR data year (i.e., the components of the calculation of the JIF). The graph has similar functionality as the JIF Trend graph, including hover-over data for each data point, and an interactive legend where hovering over a data element’s legend highlights that element in the body of the graph. In this way, users can view the specific contributions of Articles, Reviews, or Non-Citable (other) items to the JIF numerator.
- A link to generate a printable version of the graph opens a new window containing a view of the fully expanded graph.
- The x-axis is standardized to display citation counts from one to 50, with an additional group on right hand limit of >50. The y-axis shows how many items had the x-value of citations in the JCR data year. All journals are displayed on the same x-axis, allowing easy visual comparison of the “impact profile” of different journals. The y-axis scales to accommodate the difference in size between journals.
- Article Citation Median shows the median citation count in the JCR year for all items with the document type “Article” and published in the year or two years prior to the JCR data year. These items are counted in the JIF denominator as “citable items.” A journal that has an Article Citation Median value of “n/a” has no materials in the JCR denominator with the article document type.
- Review Citation Median shows the median citation count in the JCR year for all items with the document type Review and published in the year or two years prior to the JCR data year. These items are also counted in the JIF denominator as “citable items.” A journal that has a Review Citation Median value of “n/a” has no materials in the JCR denominator with the review document type.
- Items included in the Other category on the graph comprise the non-scholarly materials in the journal, including such things as Editorials, news items, correspondence, corrections, obituaries, etc. These are considered non-scholarly and are not counted as part of the denominator of the JIF, however, they may receive citations. Citations to the non-scholarly content are an important part of how the journal influences the scholarly literature, and are included in the JIF numerator.
- Non whole-number medians are rounded up to the next highest whole number value to simplify display.
- Expanding the graph provides additional detail, the full legend for the display and pop-up details for the data. In expanded mode, hovering over any bar in the graph will show a summary display of the document types and counts that are present at the specific level of citation.
- Expanded view also shows a count of unlinked citations. The JIF is calculated using all citations that can be aggregated to the journal, whether or not they can be linked to an individual published item in the journal. Different journals will have different proportions of unlinked citations. Well established journals with clear, consistent citation metadata support citing authors in creating accurate, effective citations.
- An additional element on the Citation Distribution graph is the items that have no linked citations in the JIF data year. These items are shown as “0 Times Cited” in a separate legend analogous to the hover-over data for each of the counted citation values in the body of the graph. Uncited items with the document type Article or Review are also shown on the list of JIF Contributing Items, as part of the Citable items list.
This presents the mathematical details of the JIF. It displays the year-by-year count of citations (numerator) and citable items (denominator) that were used to calculate the JIF as published.
The small arrow along the right side of the JIF calculation panel indicates which part of the calculation displays in the adjacent contributing items panel. The image here indicates the denominator items are displayed. Clicking the numerator or denominator opens a modal providing article-level detail on the sources of the number. JIF includes citations to any content in the journal, from any content in Web of Science Core Collection with the publication year = JCR data year:
- Science Citation Index Expanded
- Social Sciences Citation Index
- Arts & Humanities Citation Index
- Conference Proceedings Citation Index – Science
- Conference Proceedings Citation Index – Social Sciences and Humanities
- Book Citation Index –Sciences
- Book Citation Index – Social Sciences & Humanities
- Emerging Sources Citation Index
This panel contains:
- Citable items (the JIF denominator)
- Citations in the JCR year (JIF numerator)
JIF contributing items provides full visibility and full transparency to the data that were used to calculate the JIF for the current year.
The default view is focused on the JIF denominator, the articles and reviews that are counted as “citable” content. On the journal profile page view, items are shown, in descending order according to the number of citations they received in the JIF year (i.e., according to their contribution to the JIF numerator), in addition to their presence in the JIF denominator. This will correlate to the citation counts displayed in the Citation Distribution graph. Items are linked individually to their current version in Web of Science. These data allow users to understand journal citation performance in the context of article citation performance, and vice versa.
Clicking Citations in [JCR data year] opens a list of the top 10 journals according to the number of citations they contributed to the JIF numerator. These data are an extract of the Cited Journal data present in the All Years tab. From either Citable items (numerator), or Citations (denominator), clicking Show all will open a modal with the full set of data in a scrolled list.
The full list of citable items displays all items included in the JIF denominator, ranked in descending order by their citation contribution to the numerator. Items with zero citations in the JCR year also display. Scroll to the bottom to view. Each item is linked to its current data in Web of Science. Please be aware the JCR is a snapshot of the citation indexes at the time of JCR extraction. Web of Science receives daily updates, as well as ongoing corrections. The current data in Web of Science may show some variance from the data in JCR. The “View in Web of Science” link at the top of the Show All view will open the list of items as a search to the current version of Web of Science, subject to your entitlements. This provides you with full article navigation, metadata, analytics and metrics on this population. You will receive a pop-up information page alerting you to the possible differences between the fully transparent JIF data and the current data in Web of Science. Large journals may take time to load the view in Web of Science page. The Export link will download a CSV file with a minimum bibliographic record with Web of Science accession numbers.
A full list of citing publications displays. After a short while, the first publication listed will expand to show the individual items that contained one or more citations to the JIF numerator of the journal on this profile page. Scrolling or other functionality will be slowed until the first listing expands. If you click + next to any citing publication, it will expand to show the list of citing items in that publication. All items are presented, ranked in descending order by their citation contribution. Each item is linked to its current data in Web of Science.
The + next to any citing article will expand to show the specific reference that was counted in the JIF numerator. Unlinked citations will have some variability in the amount of metadata they present, but all include the version of the cited work, cited volume and cited year that were used to define the relationship to this journal and aggregate this reference into the JIF numerator. View in Web of Science will create a search for all citing items. For numerators in excess of 40,000 citing works, the search will be broken into two or more sets that must be called individually. The sets can be combined with a Boolean “or” through Web of Science Search History to allow the full list to be viewed and manipulated. The citing items you see in Web of Science will depend on your institution’s subscriptions. All data used to calculate the JIF are presented in the JCR, whether or not your organization subscribes to the edition, and a non-navigable version of the record can be viewed by clicking on the item in the JCR Show All pop-up window
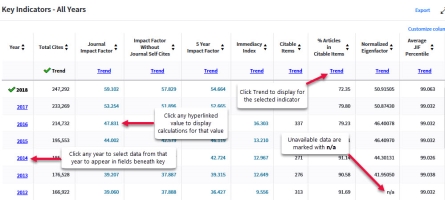
The key indicators tile includes all journal-level metrics for the current JCR year, as shown on the All Years tabular view. This allows the Journal Profile page to function as a complete summary of the journal’s current year performance.
Key indicators for each journal are displayed in the table that greets you on the Journal Profile. Many indicator values can be clicked, and a pop-up window displays the data from which that year's metric was calculated. Additionally, visualizations are also accessible by clicking Graph for any indicator of your choosing. The graph appears directly below the table. Clicking the hyperlinked year allow you to jump directly to that year's data.
For each year that a journal was published, the Journal Impact Factor displays as a hyperlink.Clicking the link opens a pop-up window of the calculations for that number.
The Journal Impact Factor is calculated by dividing citations to recent items by the number of recent items. For journals published in 2016 or later, the denominator in the calculation, the number of recent items, is a hyperlink that opens a list of recent items.
Each journal covered in the Journal Citation Reports has a page providing a comprehensive overview of related information and Key Indicators, allowing users to see multiple years' worth of data in a glance. Information related to the journal's publisher, location, and publication frequency, as well as other criteria relevant are presented at the top of the page beneath the title.
A journal's Open Access (OA) status is marked by
the ![]() icon.
icon.
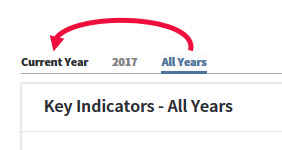
To navigate back to the Current Year journal profile page, click the Current Year tab:

The Metric Trends graph appears under the Key Indicators table when you click Graph for any of the indicators. The chosen indicator will appear as the Y axis label, while the X axis will always represent the JCR Years. JCR Years are visible for either the last five years by default, or you can select View All Years.
This panel contains the following elements:
- Source Data - shows the number of citable items in the JCR year.
- Box Plot - displays Impact Factor information in box plots for each Subject Category in which the journal is included.
- Rank - ranking information by year and Journal Impact Factor Percentile for each category in the JCR in which the journal is included as well as Essential Science Indicators information for Total Citations.
- Cited Journal Data - also includes Journal Cited Half-Life information.
- Citing Journal Data - also includes Journal Citing Half-Life information.
- Journal Relationships - data visualization based around the journal which provides a chord diagram for cited or citing data of the top twenty journals in the parent journal's network.
The final panel uses JCR year source data, and the two prior years to develop a picture of the countries, regions, and organizations that have published materials in this journal in the past three years. Expanding the window will provide up to 50 rank-order positions for the content contributed. The list can be exported as a CSV file.
This feature introduces new descriptive data in the Journal Citation Reports (JCR) journal profile pages. The new tile displays a breakdown of the journal’s articles by Open Access (OA) type.
For a hybrid journal—one that publishes both OA content and subscription content—users can easily identify the number of articles published under a subscription access model and identify those published under Creative Commons licenses (gold open access). The goal is to increase transparency around how these articles contribute to a journal’s citations.
The data included in this tile summarizes the items published in the journal in the JCR data year and in the previous two years. For example, in the 2018 JCR data, released in June 2019, the Open Access data shows the publication model (OA or subscription) of materials published in 2016, 2017, 2018 , and citations in 2018 to these items. All three tiles in this section of the profile page—OA data, Contributions by Country/Region, and Contributions by Organization —use this three-year set of published items to provide descriptive analysis of the content and community of the journal.
The identification of the OA types comes from Our Research (formerly ImpactStory), the same source used for Web of Science and InCites Open Access identification.
Learn more on our Open Access help page.


